FedEx Earnings Highlight Trade War Uncertainties

FedEx (FDX) reports earnings after Thursday’s close, a potential catalyst that could shake up months of rangebound activity for shares that have been stuck in a sideways grind between about 215 and 245 after calming down from the tariff announcements shook markets in April.
The Street is looking for the shipping giant’s numbers to come in at $3.65 EPS against $3.60 one year ago (+1.4%) and for revenue of 21.7B vs. last year’s 21.58B (+0.91%), according to Zacks. Meanwhile, the options market shows the potential expected move for the Sept. 19 expiration is about 209 to 245, roughly +/-7.9%.
The shipping and freight industries have long been viewed as sources of potential clues about broader economic activity, but also now stand out as sectors that would be particularly sensitive to tariffs and other Trade War-related issues. For example, President Trump in July moved to eliminate de minimis shipping exemptions through an executive order that took effect on Aug. 29, which now means that any shipments of goods imported into the U.S. that are worth $800 or less now must pay tariffs related to the value of the package and in which country it was produced.
This has already negatively impacted companies in southeast Asia, especially Chinese companies like Temu and Shein. According to U.S. government data, about 73% of de minimis packages entering the U.S. originated from China in 2024.
The de minimis elimination prompted Bank of America to downgrade FDX to Neutral from Buy and lower their target to $240 from $245, with an accompanying downgrade for its shipping archrival UPS (UPS). Susquehanna and Goldman Sachs also recently cut their price targets to $285 and $276 respectively. However, Bernstein today bumped their price target to $249 from $247 and kept their Market Perform rating.
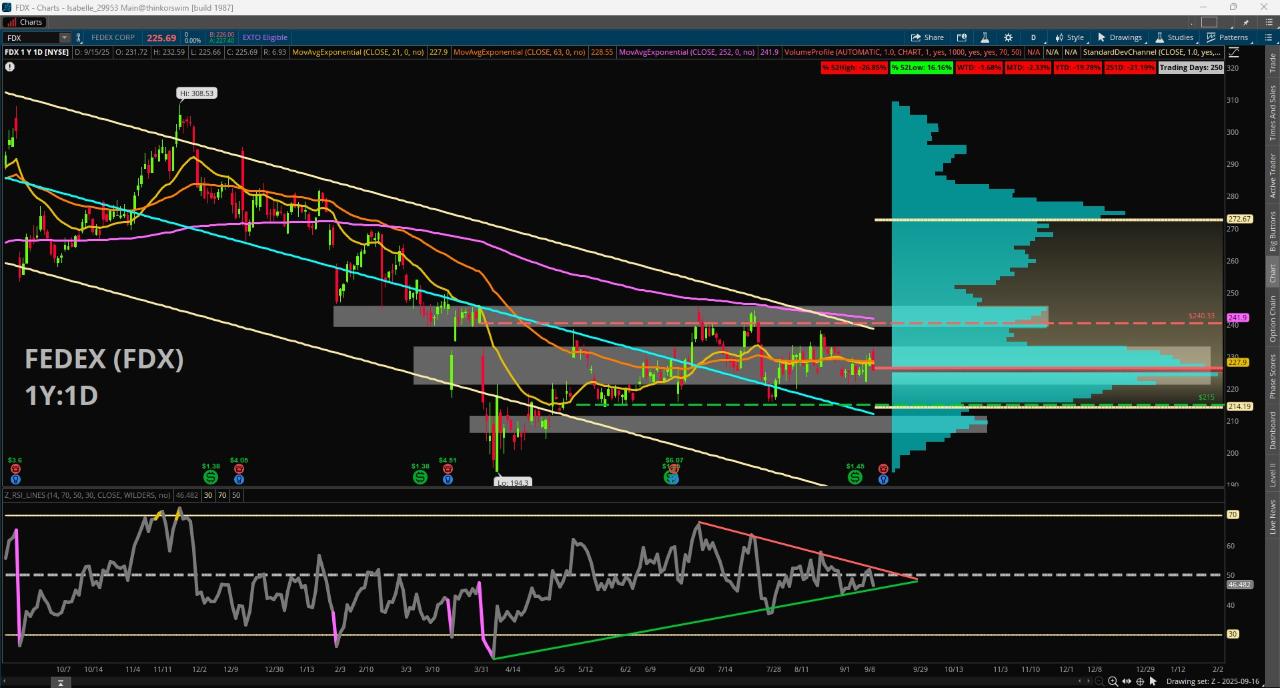
The chart shows largely sideways price action centered around the yearly Volume Profile Point of Control near 226. Momentum is sluggish as well with the Relative Strength Index (RSI) compressing into an increasingly narrowing triangular range centered around the 50 midline. Yesterday’s -1.68% drop not only took price below the Volume Profile POC but also a confluence of the 21-day and 63-day Exponential Moving Averages near about 228.
The move also formed a Bearish Engulfing candle, but the very near earnings date disrupts the implications of that potentially bearish setup. To the upside, the 240 level marks the low point before a gap down in early April and an area that price subsequently failed to break above twice. To the downside, the 215 level marks a triple bottom that formed in recent months.